
Property Tax Calculator
Rates are effective rates from the Census ACS 2023 5-year survey: median real-estate taxes paid ÷ median owner-occupied home value, per state and county. Your bill depends on the assessed value and the mill rates of every district you sit in, so use the result as a planning figure and check the county assessor for the exact levy. Not tax advice.
Type a home value, pick the state and county, and see the yearly and monthly property tax, the effective rate, how it compares with the state and U.S. average, and what ten years of bills add up to.
Enter the price you paid or expect to pay, choose the state and (once the list loads) the county, and the calculator multiplies the value by that area’s effective property-tax rate — what owners there actually pay as a share of what their homes are worth. If your area taxes only part of market value or gives a homestead exemption, enter those and the estimate uses the taxable value instead. The verdict compares your rate with the U.S. average of 0.98%.
How much is property tax on a $300k house?
At the U.S. average effective rate of 0.98%, property tax on a $300,000 house is about $2,937 a year, or $245 a month in escrow. Where you live changes that figure by a factor of eight: the same house owes roughly $6,693 in New Jersey (2.23%), $6,213 in Illinois, $4,737 in Texas and $810 in Hawaii (0.27%).
Those are state-wide medians. Inside a state the spread is nearly as wide — a $300k house in El Paso County, Texas (2.09%) pays about $6,258 while one in Travis County (1.53%) pays $4,605 — which is why the calculator lets you pick the county. If you already have a monthly payment in mind, remember that tax and insurance commonly add 20–30% on top of principal and interest; the monthly payment by home price tool shows the full PITI figure.

Effective rate vs. mill rate: how a property tax bill is actually computed
Your county does not charge a percentage of what you paid. It charges a mill rate — dollars per $1,000 — on an assessed value that may be a fraction of market value, after subtracting any exemptions. The chain is:
market value × assessment ratio − exemptions = taxable value; taxable value × (total mills ÷ 1,000) = tax.
A worked example in the Texas pattern: a $300,000 house assessed at 100% with a $100,000 school-district homestead exemption and a combined levy of 2.0% from the school district, county, city and college district owes ($300,000 − $100,000) × 2.0% = $4,000, which is 1.33% of market value. In a state that assesses at 35% (Ohio) with 65 mills, the same house owes $300,000 × 0.35 × 0.065 = $6,825 — but Ohio’s rollbacks and reduction factors pull the real bill far below that, which is exactly why the quoted mill rate is a poor way to compare places.
The effective rate cuts through all of it: the tax actually paid divided by the market value. Every rate on this page is an effective rate from the Census Bureau’s American Community Survey — the median real-estate tax bill reported by owners (table B25103) divided by the median value they report (B25077), so it already includes exemptions, caps and every overlapping district. Use the assessment-ratio and exemption fields only when you know your own figures are different from the local norm; for a typical owner-occupied house, leaving them at 100% and $0 with the county rate is the better estimate.
Property tax by state, ranked by effective rate
New Jersey, Illinois and Connecticut lead the country; Hawaii, Alabama and Colorado sit at the bottom. The rank order is driven by two things: how much of local government (above all schools) is funded by property rather than income or sales tax, and how high home values are relative to the budgets being raised. Texas and New Hampshire, with no state income tax, land in the top ten; Hawaii and California, with high values and assessment caps, land low even though the dollar bills there are not small.
| State | Effective rate | Median tax paid | Median home value | Tax on $300k |
|---|---|---|---|---|
| 1. New Jersey | 2.23% | $9,541 | $427,600 | $6,693 |
| 2. Illinois | 2.07% | $5,189 | $250,500 | $6,213 |
| 3. Connecticut | 1.92% | $6,575 | $343,200 | $5,748 |
| 4. New Hampshire | 1.77% | $6,505 | $367,200 | $5,316 |
| 5. Vermont | 1.71% | $4,956 | $290,500 | $5,118 |
| 6. New York | 1.60% | $6,450 | $403,000 | $4,800 |
| 7. Texas | 1.58% | $4,111 | $260,400 | $4,737 |
| 8. Wisconsin | 1.51% | $3,746 | $247,400 | $4,542 |
| 9. Nebraska | 1.50% | $3,350 | $223,800 | $4,491 |
| 10. Iowa | 1.43% | $2,795 | $195,900 | $4,281 |
| 11. Ohio | 1.36% | $2,712 | $199,200 | $4,083 |
| 12. Pennsylvania | 1.35% | $3,241 | $240,500 | $4,044 |
| 13. Rhode Island | 1.32% | $4,854 | $368,800 | $3,948 |
| 14. Kansas | 1.30% | $2,643 | $203,400 | $3,897 |
| 15. Michigan | 1.28% | $2,795 | $217,600 | $3,852 |
| 16. Alaska | 1.14% | $3,785 | $333,300 | $3,408 |
| 17. Massachusetts | 1.11% | $5,813 | $525,800 | $3,318 |
| 18. Maine | 1.10% | $2,926 | $266,400 | $3,294 |
| 19. South Dakota | 1.09% | $2,590 | $236,800 | $3,282 |
| 20. Minnesota | 1.04% | $3,184 | $305,500 | $3,126 |
| 21. Maryland | 1.00% | $3,989 | $397,700 | $3,009 |
| 22. North Dakota | 0.99% | $2,392 | $241,100 | $2,976 |
| 23. Missouri | 0.88% | $1,887 | $215,600 | $2,625 |
| 24. Washington | 0.84% | $4,361 | $519,800 | $2,517 |
| 25. Oregon | 0.83% | $3,767 | $454,200 | $2,487 |
| 26. Oklahoma | 0.82% | $1,520 | $185,900 | $2,454 |
| 27. Georgia | 0.81% | $2,214 | $272,900 | $2,433 |
| 28. Florida | 0.79% | $2,555 | $325,000 | $2,358 |
| 29. Kentucky | 0.77% | $1,472 | $192,300 | $2,295 |
| 30. Montana | 0.75% | $2,535 | $338,100 | $2,250 |
| 31. Virginia | 0.74% | $2,686 | $360,700 | $2,235 |
| 32. Indiana | 0.74% | $1,496 | $201,600 | $2,226 |
| 33. Mississippi | 0.74% | $1,189 | $161,400 | $2,211 |
| 34. New Mexico | 0.72% | $1,669 | $232,200 | $2,157 |
| 35. California | 0.71% | $4,926 | $695,400 | $2,124 |
| 36. North Carolina | 0.70% | $1,815 | $259,400 | $2,100 |
| 37. Wyoming | 0.58% | $1,659 | $285,100 | $1,746 |
| 38. District of Columbia | 0.58% | $4,180 | $724,600 | $1,731 |
| 39. Arkansas | 0.57% | $1,003 | $175,300 | $1,716 |
| 40. Louisiana | 0.55% | $1,146 | $208,700 | $1,647 |
| 41. Tennessee | 0.55% | $1,400 | $256,800 | $1,635 |
| 42. West Virginia | 0.54% | $835 | $155,600 | $1,611 |
| 43. Idaho | 0.53% | $2,006 | $376,000 | $1,602 |
| 44. Delaware | 0.53% | $1,731 | $326,800 | $1,590 |
| 45. Utah | 0.53% | $2,412 | $455,000 | $1,590 |
| 46. Arizona | 0.52% | $1,858 | $358,900 | $1,554 |
| 47. South Carolina | 0.51% | $1,199 | $236,700 | $1,521 |
| 48. Colorado | 0.49% | $2,448 | $502,200 | $1,461 |
| 49. Nevada | 0.48% | $1,970 | $406,100 | $1,455 |
| 50. Alabama | 0.38% | $738 | $195,100 | $1,134 |
| 51. Hawaii | 0.27% | $2,183 | $808,200 | $810 |
Effective rate = median real-estate taxes paid (B25103) ÷ median owner-occupied value (B25077), Census ACS 2023 5-year. The ACS tops out reported taxes at $10,000+, so rates in the priciest parts of NJ, NY, CT, CA and MA are slightly understated. Click a state for its home-value page and county list.
Read the table two ways. The rate tells you what a given purchase price costs to hold each year; the median bill tells you what owners there actually write cheques for. California is the clearest split: a 0.71% rate looks cheap, but on a $695,400 median home it is a $4,926 bill — more than Texas owners pay at more than twice the rate.
Tax on a $300k, $500k and $750k home in the highest- and lowest-tax states
Multiplying each state’s rate through three common price points shows how fast the gap compounds. A $500,000 house in New Jersey costs about $11,155 a year to hold in property tax — $930 a month, roughly what the principal and interest on a $150,000 mortgage would be. In Hawaii the same price owes $1,350.
| State | Rate | $300,000 home | $500,000 home | $750,000 home | $500k home per month |
|---|---|---|---|---|---|
| New Jersey | 2.23% | $6,693 | $11,155 | $16,733 | $930/mo |
| Illinois | 2.07% | $6,213 | $10,355 | $15,533 | $863/mo |
| Connecticut | 1.92% | $5,748 | $9,580 | $14,370 | $798/mo |
| New Hampshire | 1.77% | $5,316 | $8,860 | $13,290 | $738/mo |
| Vermont | 1.71% | $5,118 | $8,530 | $12,795 | $711/mo |
| New York | 1.60% | $4,800 | $8,000 | $12,000 | $667/mo |
| Texas | 1.58% | $4,737 | $7,895 | $11,843 | $658/mo |
| Wisconsin | 1.51% | $4,542 | $7,570 | $11,355 | $631/mo |
| Nebraska | 1.50% | $4,491 | $7,485 | $11,228 | $624/mo |
| Iowa | 1.43% | $4,281 | $7,135 | $10,703 | $595/mo |
| United States average | 0.98% | $2,937 | $4,895 | $7,343 | $408/mo |
| West Virginia | 0.54% | $1,611 | $2,685 | $4,028 | $224/mo |
| Idaho | 0.53% | $1,602 | $2,670 | $4,005 | $223/mo |
| Delaware | 0.53% | $1,590 | $2,650 | $3,975 | $221/mo |
| Utah | 0.53% | $1,590 | $2,650 | $3,975 | $221/mo |
| Arizona | 0.52% | $1,554 | $2,590 | $3,885 | $216/mo |
| South Carolina | 0.51% | $1,521 | $2,535 | $3,803 | $211/mo |
| Colorado | 0.49% | $1,461 | $2,435 | $3,653 | $203/mo |
| Nevada | 0.48% | $1,455 | $2,425 | $3,638 | $202/mo |
| Alabama | 0.38% | $1,134 | $1,890 | $2,835 | $158/mo |
| Hawaii | 0.27% | $810 | $1,350 | $2,025 | $113/mo |
Home value × state effective rate (ACS 2023). Your county rate may be well above or below the state figure — pick it in the calculator.
What to do with this: when you compare two states or two counties for a move, add the annual tax difference to the mortgage difference before you decide, because the tax does not amortise away — it rises with values for as long as you own. Over 10 years the NJ–Hawaii gap on a $500k house is about $98,050. The relocation calculator runs that comparison with income and housing costs included.
County property-tax rates: where the state average misleads
Counties set their own levies and so do the school districts, cities and special districts inside them, so a state figure hides a wide band. Among counties with at least 100,000 people, the highest effective rates cluster in New Jersey, upstate New York and the Chicago collar counties; the lowest are in Alabama and Hawaii. The calculator’s county list (loaded from the Census data for 3,222 counties) shows each county’s rate next to its name so you can scan a whole state in one dropdown.

| County | Effective rate | Median tax paid | Median home value | Tax on $400k |
|---|---|---|---|---|
| Camden County, NJ | 3.08% | $8,063 | $262,200 | $12,300 |
| Gloucester County, NJ | 2.81% | $7,964 | $283,500 | $11,236 |
| Monroe County, NY | 2.79% | $5,495 | $197,100 | $11,152 |
| Lake County, IL | 2.68% | $8,743 | $326,600 | $10,708 |
| Broome County, NY | 2.63% | $3,824 | $145,100 | $10,540 |
| Onondaga County, NY | 2.59% | $4,805 | $185,300 | $10,372 |
| Oswego County, NY | 2.58% | $3,595 | $139,600 | $10,300 |
| DeKalb County, IL | 2.54% | $5,889 | $231,900 | $10,156 |
| Kendall County, IL | 2.53% | $7,556 | $298,900 | $10,112 |
| Warren County, NJ | 2.52% | $8,156 | $323,100 | $10,096 |
| Baldwin County, AL | 0.31% | $881 | $287,000 | $1,228 |
| Limestone County, AL | 0.31% | $782 | $255,100 | $1,228 |
| Houston County, AL | 0.30% | $534 | $178,000 | $1,200 |
| Hawaii County, HI | 0.29% | $1,392 | $486,400 | $1,144 |
| Honolulu County, HI | 0.28% | $2,482 | $873,000 | $1,136 |
| Maui County, HI | 0.17% | $1,442 | $858,600 | $672 |
Census ACS 2023 5-year, counties with population ≥ 100,000. Linked counties have a SmarterSquares home-values page with ZIP-level data.
In Texas, the big urban counties run from Travis County at 1.53% to El Paso County at 2.09%. Every state and county page under home values — for example Texas or Travis County — carries the local medians the calculator uses, down to the ZIP code.
Assessment caps, homestead exemptions and what happens when you buy
Three mechanisms explain why your neighbour’s bill can be half of yours for the same house.
Assessment caps
- California (Prop 13, 1978): assessed value is the purchase price, rising at most 2% a year, taxed at 1% plus local voter-approved bonds (typically 1.1–1.25% total). A house bought in 1995 may be assessed at a third of its market value. On sale it resets to the new price — budget on the price you pay, not the seller’s old bill.
- Florida (Save Our Homes): homesteaded assessments rise at most 3% a year or the CPI, whichever is lower, with up to $500,000 of the accumulated discount portable to the next Florida homestead. Non-homestead property is capped at 10%. The cap resets when the property changes hands.
- Other caps: Texas limits homestead appraisal growth to 10% a year; Michigan’s taxable value grows by inflation or 5% until a sale “uncaps” it; Oregon and Arizona cap assessed-value growth as well.
Homestead exemptions
Most states take a fixed amount or a percentage off the assessed value of a primary residence. Texas raised its school-district homestead exemption to $100,000 in 2023 and to $140,000 ($200,000 for owners 65+ or disabled) with the November 2025 constitutional amendment; Florida’s is $50,000 (half of it applying to non-school levies); Georgia, Louisiana, Oklahoma and many others use smaller fixed amounts, and most states add larger exemptions or freezes for owners over 65, veterans and the disabled. Exemptions are not automatic — you file once, usually by March or April after you move in.
Reassessment on sale
Because caps and exemptions belong to the previous owner, the bill on a listing sheet is often the lowest number you will ever see for that house. Ask the agent for the uncapped assessment or simply run the purchase price through the calculator at the county rate; in a capped state, expect the first full-year bill to be noticeably higher than the seller’s last one.
How to appeal a property tax assessment
- Read the notice and the deadline. Assessment notices go out once a year (or every few years in states that reassess on a cycle); the window to protest is usually 30–45 days from the mailing date.
- Check the record card. Square footage, bedroom count, lot size, condition and finished-basement area are wrong surprisingly often. A factual error is the easiest win.
- Pull three to five comparable sales from the 6–12 months before the valuation date: same neighbourhood, similar size and age, lower price per square foot. Price-per-square-foot data by ZIP is on the price per square foot page.
- Compare with neighbours’ assessments (public record): equal houses assessed unequally is a valid argument in most states.
- File the informal review first — many assessors adjust without a hearing — then the formal board appeal if needed. Bring photos of defects and a one-page summary.
- Do the math before you hire help. Appeal firms take 25–50% of the first year’s saving. On a $300k house a 10% cut in assessed value at a 1.5% rate saves $450 a year; worth an afternoon, rarely worth a contingency fee.
Winning lowers the assessed value, not the mill rate, so the saving carries forward until the next reassessment — and in a capped state it also lowers the base the cap grows from.
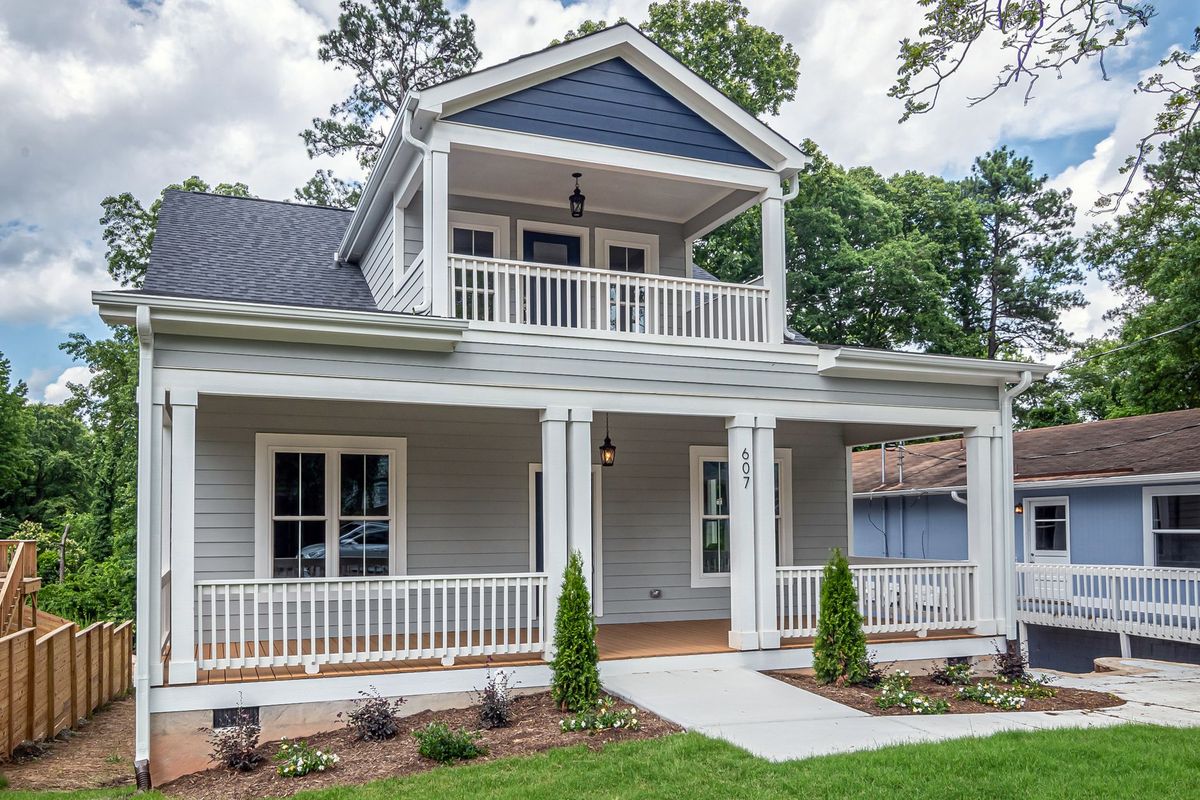
Property tax in your monthly mortgage payment (escrow)
Lenders collect property tax monthly and pay the county for you. The escrow line is simply the annual tax ÷ 12, plus a cushion of up to two months that federal rules allow the servicer to hold. On the $300k example at the U.S. average, that is $245 a month; in New Jersey it is $558. Because the tax is re-estimated every year, the escrow payment moves even on a fixed-rate loan — a reassessment or a levy increase shows up as a higher payment plus a one-time “shortage” catch-up.
Two decisions follow from the number:
- Affordability. Lenders count tax inside the front-end debt ratio, so a high-tax county lowers the price you qualify for. At a 28% housing ratio, every $100 a month of tax removes roughly $17,000 of purchase price at a 6.25% rate. The how much house can I afford by salary tool uses each state’s rate for exactly this.
- Comparing two houses. A cheaper house in a high-tax district can cost more per month than a dearer one next door. Run both through the calculator and add the result to the principal and interest from the mortgage calculator before you offer.
If the tax jump at purchase surprises you, the lender will usually have set the first escrow from the seller’s old bill — ask for it to be based on the purchase price so you are not hit with a shortage in year two.
How this property tax calculator works and where the numbers come from
Property tax = (home value × assessment ratio − homestead exemption) × effective rate. The effective rate for every state and county is the Census ACS 2023 5-year median real-estate taxes paid (table B25103) divided by the median owner-occupied home value (B25077) for that geography; the U.S. figure is 0.98% ($2,969 on $303,400). Because the ACS top-codes taxes at $10,000+, rates in the most expensive areas are slightly understated. The multi-year total holds the bill flat; real bills rise with assessments. County rates load from a 3,200-county table built from the same survey. Not tax or financial advice.
- U.S. Census Bureau, American Community Survey 2023 5-year: B25103 (median real estate taxes paid) and B25077 (median value)
- California Board of Equalization: Proposition 13 and assessed value
- Florida Department of Revenue: Save Our Homes assessment limitation and homestead exemption
- Texas Comptroller: residence homestead exemptions
- Consumer Financial Protection Bureau: escrow accounts (Regulation X cushion)
Last reviewed November 6, 2026. Estimates only — verify local figures before you commit money.
Property Tax Calculator: FAQ
How much is property tax on a $300,000 house? +
About $2,937 a year at the U.S. average effective rate of 0.98%, or $245 a month. It ranges from roughly $810 in Hawaii to $6,693 in New Jersey, and the county you are in can push the figure well outside the state average.
Which state has the highest property taxes? +
New Jersey, with an effective rate of 2.23% and a median bill of $9,541 (Census ACS 2023). Illinois (2.07%), Connecticut (1.92%), New Hampshire (1.77%) and Vermont (1.71%) follow. Texas is the highest-rate state without an income tax at 1.58%.
Which state has the lowest property taxes? +
Hawaii, at 0.27% of home value, followed by Alabama (0.38%), Colorado and Nevada (0.49%), South Carolina (0.51%) and Arizona. In dollars the cheapest median bills are in Alabama ($738) and West Virginia ($835) because home values there are low as well.
What is the average property tax rate in the U.S.? +
0.98% of home value: the median American owner paid $2,969 on a home worth $303,400 in the 2023 ACS. Most states fall between 0.5% and 1.5%; seven are above 1.5% and only Hawaii is below 0.4%.
How is property tax calculated? +
Taxable value × mill rate ÷ 1,000. The assessor sets a value, the state’s assessment ratio and any homestead exemption reduce it to a taxable value, and every district you live in (county, school, city, special districts) adds its mills. The effective rate — tax paid ÷ market value — is the simplest way to compare places, and it is what this calculator uses.
Does property tax go up when you buy a house? +
Often, yes. In states with assessment caps (California, Florida, Texas, Michigan and others) the previous owner’s taxable value was frozen or limited, and a sale resets it to the purchase price. Estimate your first full-year bill from the price you pay at the county’s effective rate, not from the seller’s last bill.
How do I lower my property tax? +
File for every exemption you qualify for (homestead, senior, veteran, disability), check the assessor’s record card for errors, and appeal the assessment with recent comparable sales if it is above market value. Appeals are free to file in most counties and must be lodged within the window printed on the notice, typically 30–45 days.
Is property tax included in my mortgage payment? +
Usually: lenders collect one-twelfth of the annual tax each month in an escrow account and pay the county on your behalf, holding up to a two-month cushion. The escrow portion is re-estimated yearly, so a fixed-rate mortgage payment still rises when the tax bill does.
Related tools and data
Monthly Payment by Home Price
Full PITI payment with your state’s tax and insurance.
How Much House Can I Afford by Salary
Max price from your income, with the state tax rate built in.
Home Values by State, County and ZIP
Median values, taxes and incomes for every state and county.
Home Insurance Cost Calculator
The other half of escrow: premiums by state and home value.
Mortgage Calculator
Principal and interest, amortisation and payoff schedule.
Relocation Calculator
Compare housing, taxes and income between two places.