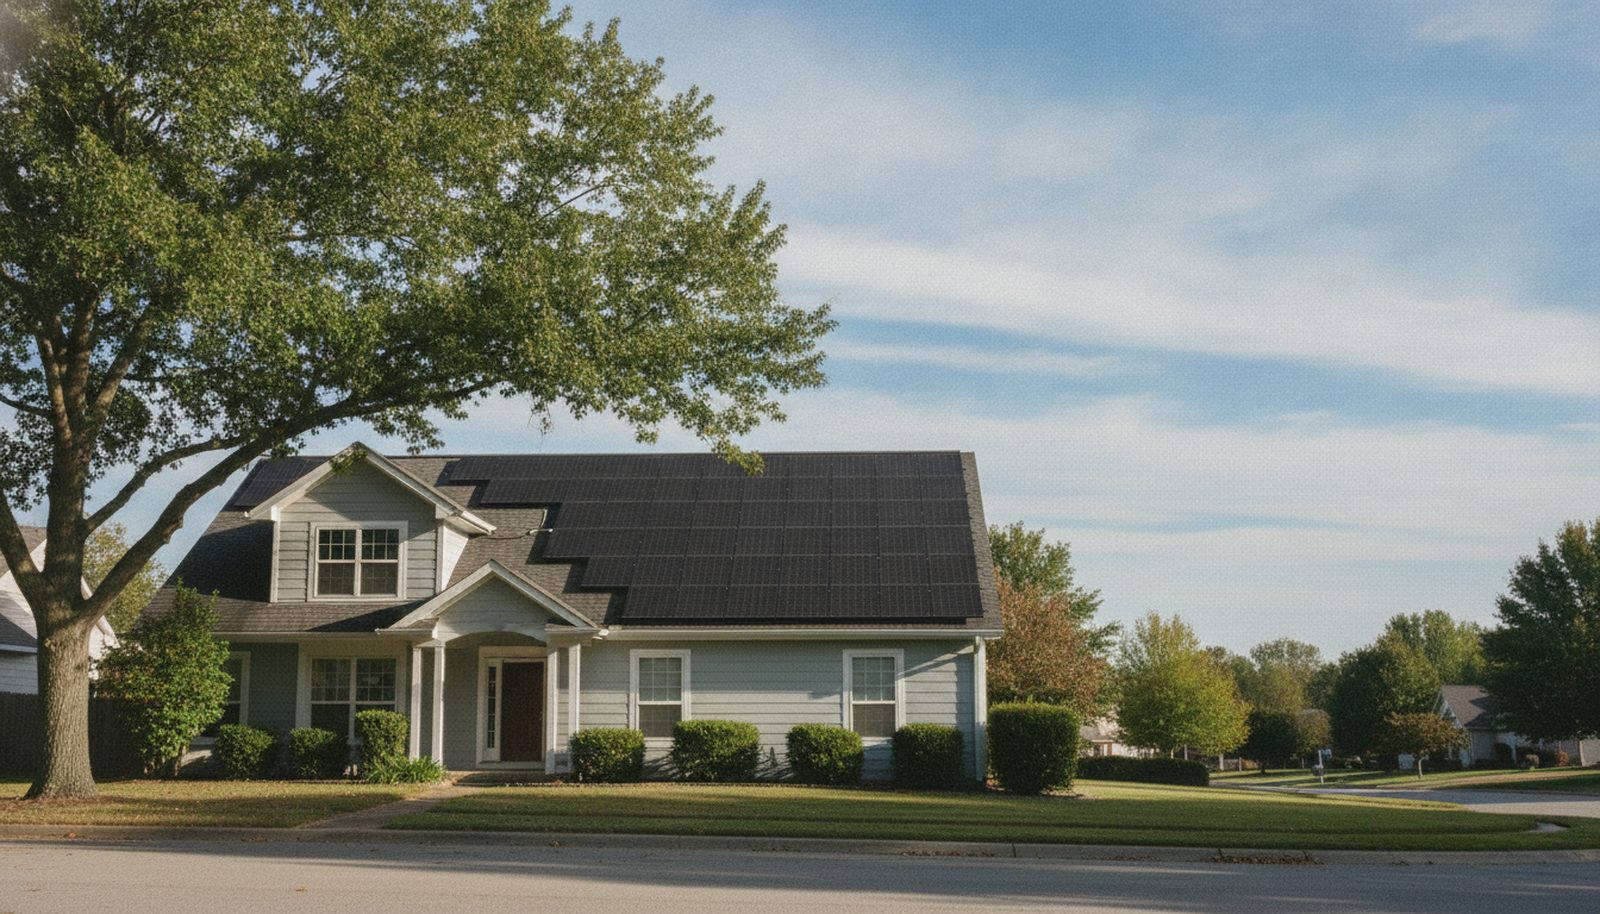
Solar Panel Calculator: How Many Panels Do You Need?
Production = kW × peak sun hours × 365 × (1 − losses) × orientation factor; panels at 20 sq ft each. Savings value self-consumed power at your retail price and surplus at the export rate you pick; the 25-year figure grows savings at your price-growth rate and degrades output 0.5% a year, with no inverter replacement, loan interest or maintenance. The federal residential credit (§25D) ended for systems placed in service after December 31, 2025, so it is off by default. Sun hours are state-wide annual averages (NREL); prices are EIA August 2026 residential averages.
Type your monthly electric bill (or kWh), pick your state and the calculator sizes the system from local sun hours and the August 2026 electricity price: panel count, roof area, installed cost, year-one savings and simple payback — with no federal credit, which ended for 2026 purchases.
Pick your state and the calculator fills in the state’s annual-average peak sun hours and the August 2026 residential electricity price (both editable), then converts your bill to kilowatt-hours, sizes a system to cover the offset you choose, and prices it at your cost per watt. The money rows show the year-one savings at your retail price, the simple payback and the 25-year net savings. The federal credit box is off because the residential credit (§25D) ended for systems placed in service after December 31, 2025; tick it only for a system that was already running before then.
How many solar panels does it take to power a house?
The average U.S. home uses 863 kWh a month (10,356 kWh a year, EIA 2024), and in average U.S. sun that takes 20 panels of 400 W — an 8.0 kW system on about 400 sq ft of roof — to produce the same amount over a year. Houses range from 12 panels in a sunny, mild state with gas heat to 30 or more in a northern state with electric heat, an EV or a pool pump.
The math has three steps. Each kilowatt of panels produces about 1,310 kWh a year at 4.6 peak sun hours a day after 22% system losses (4.6 × 365 × 0.78). Divide the annual use by that figure: 10,356 ÷ 1,310 = 7.9 kW. Divide the kilowatts by the panel size: 7,908 W ÷ 400 W = 19.8, rounded up to 20 panels. Your bill does the same job if you do not know your kWh: at the national average of 18.2¢ per kWh, a $157 bill is 863 kWh.
| Monthly bill | kWh per month | System size | Panels | Roof sq ft | Installed cost | Year-one savings |
|---|---|---|---|---|---|---|
| $75 | 413 | 4.0 kW | 10 | 200 | $12,000 | $951 |
| $100 | 551 | 5.2 kW | 13 | 260 | $15,600 | $1,237 |
| $150 | 826 | 7.6 kW | 19 | 380 | $22,800 | $1,807 |
| $200 | 1,101 | 10.4 kW | 26 | 520 | $31,200 | $2,473 |
| $250 | 1,377 | 12.8 kW | 32 | 640 | $38,400 | $3,044 |
| $300 | 1,652 | 15.2 kW | 38 | 760 | $45,600 | $3,615 |
| $400 | 2,203 | 20.4 kW | 51 | 1,020 | $61,200 | $4,852 |
| $500 | 2,753 | 25.6 kW | 64 | 1,280 | $76,800 | $6,088 |
Full retail net metering, no incentives. Cost and savings both scale with the array, so the simple payback is the same 12.6 years in every row — location changes the payback, bill size does not. Your state’s price and sun hours move every column: the same $200 bill in Hawaii is far fewer kWh (and panels) than in Louisiana.
Use the row nearest your bill as a first estimate, then put your own state in the calculator — the state table below shows why a Texas and a New York house with the same bill need different arrays. If you plan to add an EV (about 3,000–4,000 kWh a year for 12,000 miles) or a heat pump, size for the future load with the 120% offset option; adding panels later costs more per watt than installing them now.
How much energy does a solar panel produce?
A 400 W panel produces about 1.4 kWh a day in average U.S. sun — roughly 44 kWh a month and 524 kWh a year — after the 20–25% that is lost in the inverter, wiring, dirt, heat and the panel sitting at less than its lab rating. The nameplate watts are measured at 1,000 W/m² and 25 °C; a roof in July runs hotter than that and loses 10–15% to temperature alone, which is why a desert state’s extra sun hours do not scale perfectly.
“Peak sun hours” is not daylight hours. It is the number of hours of full 1,000 W/m² sun that would deliver the day’s total energy, so a 14-hour summer day in Ohio might be 6 peak sun hours and a cloudy December day 1.5. The annual average is what sizes the system; the seasonal swing is what net metering smooths out.

| Peak sun hours per day | kWh per day | kWh per month | kWh per year | Panels for 10,000 kWh/yr |
|---|---|---|---|---|
| 3.5 h | 1.1 kWh | 33 | 399 | 26 |
| 4.0 h | 1.2 kWh | 38 | 456 | 22 |
| 4.5 h | 1.4 kWh | 43 | 512 | 20 |
| 5.0 h | 1.6 kWh | 47 | 569 | 18 |
| 5.5 h | 1.7 kWh | 52 | 626 | 16 |
| 6.0 h | 1.9 kWh | 57 | 683 | 15 |
| 6.5 h | 2.0 kWh | 62 | 740 | 14 |
kWh per day = 0.4 kW × sun hours × 0.78. Washington (3.8) is near the top of the table and Alaska (3.0) below it; Arizona and New Mexico are at the bottom.
Peak sun hours by state
Sun hours decide how many panels a kilowatt-hour of demand needs. The state-wide annual averages below are rounded from NREL’s National Solar Radiation Database maps of global horizontal irradiance; they run from 3.0 in Alaska to 6.5 in Arizona. Inside a state the range is real: Southern California and the Mojave beat the California figure, the North Coast falls short; East Texas is cloudier than El Paso. The table also lists the EIA August 2026 residential price and the 2024 average monthly use, and sizes a 100%-offset system for the average home in each state at $3.00 per watt.
| State | Sun hours/day | Price Aug 2026 | Avg kWh/month | System (kW · panels) | Cost at $3/W | Year-one savings |
|---|---|---|---|---|---|---|
| Alabama | 4.6 | 16.3¢ | 1,143 | 10.8 kW · 27 | $32,400 | $2,310 |
| Alaska | 3.0 | 29.4¢ | 578 | 8.4 kW · 21 | $25,200 | $2,110 |
| Arizona | 6.5 | 15.1¢ | 1,075 | 7.2 kW · 18 | $21,600 | $2,005 |
| Arkansas | 4.7 | 14.4¢ | 1,048 | 9.6 kW · 24 | $28,800 | $1,846 |
| California | 5.8 | 29.8¢ | 503 | 4.0 kW · 10 | $12,000 | $1,965 |
| Colorado | 5.4 | 17.2¢ | 674 | 5.6 kW · 14 | $16,800 | $1,478 |
| Connecticut | 4.2 | 24.5¢ | 695 | 7.2 kW · 18 | $21,600 | $2,110 |
| Delaware | 4.4 | 18.7¢ | 911 | 8.8 kW · 22 | $26,400 | $2,061 |
| District of Columbia | 4.4 | 26.0¢ | 639 | 6.4 kW · 16 | $19,200 | $2,083 |
| Florida | 5.4 | 15.0¢ | 1,104 | 8.8 kW · 22 | $26,400 | $2,028 |
| Georgia | 5.0 | 15.9¢ | 1,074 | 9.2 kW · 23 | $27,600 | $2,082 |
| Hawaii | 5.6 | 47.2¢ | 495 | 4.0 kW · 10 | $12,000 | $3,009 |
| Idaho | 4.7 | 13.4¢ | 944 | 8.8 kW · 22 | $26,400 | $1,574 |
| Illinois | 4.3 | 19.3¢ | 693 | 6.8 kW · 17 | $20,400 | $1,608 |
| Indiana | 4.2 | 17.0¢ | 901 | 9.2 kW · 23 | $27,600 | $1,872 |
| Iowa | 4.3 | 17.1¢ | 832 | 8.4 kW · 21 | $25,200 | $1,754 |
| Kansas | 5.0 | 15.5¢ | 876 | 7.6 kW · 19 | $22,800 | $1,674 |
| Kentucky | 4.3 | 13.8¢ | 1,047 | 10.4 kW · 26 | $31,200 | $1,757 |
| Louisiana | 4.8 | 12.9¢ | 1,202 | 10.8 kW · 27 | $32,400 | $1,899 |
| Maine | 4.0 | 32.1¢ | 550 | 6.0 kW · 15 | $18,000 | $2,194 |
| Maryland | 4.4 | 21.4¢ | 929 | 9.2 kW · 23 | $27,600 | $2,466 |
| Massachusetts | 4.2 | 30.5¢ | 570 | 6.0 kW · 15 | $18,000 | $2,187 |
| Michigan | 4.0 | 23.0¢ | 618 | 6.8 kW · 17 | $20,400 | $1,780 |
| Minnesota | 4.2 | 17.2¢ | 712 | 7.2 kW · 18 | $21,600 | $1,481 |
| Mississippi | 4.7 | 14.4¢ | 1,156 | 10.4 kW · 26 | $31,200 | $2,008 |
| Missouri | 4.6 | 16.0¢ | 1,001 | 9.2 kW · 23 | $27,600 | $1,930 |
| Montana | 4.4 | 15.6¢ | 852 | 8.4 kW · 21 | $25,200 | $1,638 |
| Nebraska | 4.8 | 13.5¢ | 956 | 8.4 kW · 21 | $25,200 | $1,554 |
| Nevada | 6.2 | 12.7¢ | 930 | 6.4 kW · 16 | $19,200 | $1,437 |
| New Hampshire | 4.1 | 27.6¢ | 619 | 6.4 kW · 16 | $19,200 | $2,065 |
| New Jersey | 4.3 | 24.6¢ | 662 | 6.8 kW · 17 | $20,400 | $2,049 |
| New Mexico | 6.4 | 16.5¢ | 654 | 4.4 kW · 11 | $13,200 | $1,324 |
| New York | 4.2 | 28.6¢ | 571 | 6.0 kW · 15 | $18,000 | $2,055 |
| North Carolina | 4.9 | 14.9¢ | 1,015 | 8.8 kW · 22 | $26,400 | $1,835 |
| North Dakota | 4.4 | 13.3¢ | 1,029 | 10.0 kW · 25 | $30,000 | $1,667 |
| Ohio | 4.1 | 19.4¢ | 846 | 8.8 kW · 22 | $26,400 | $1,991 |
| Oklahoma | 5.1 | 14.8¢ | 1,079 | 9.2 kW · 23 | $27,600 | $1,980 |
| Oregon | 4.0 | 15.9¢ | 882 | 9.6 kW · 24 | $28,800 | $1,740 |
| Pennsylvania | 4.1 | 21.8¢ | 817 | 8.4 kW · 21 | $25,200 | $2,135 |
| Rhode Island | 4.2 | 28.2¢ | 567 | 6.0 kW · 15 | $18,000 | $2,022 |
| South Carolina | 5.0 | 15.8¢ | 1,050 | 9.2 kW · 23 | $27,600 | $2,064 |
| South Dakota | 4.6 | 15.2¢ | 994 | 9.2 kW · 23 | $27,600 | $1,825 |
| Tennessee | 4.5 | 13.4¢ | 1,154 | 11.2 kW · 28 | $33,600 | $1,926 |
| Texas | 5.3 | 15.9¢ | 1,096 | 8.8 kW · 22 | $26,400 | $2,113 |
| Utah | 5.3 | 13.3¢ | 774 | 6.4 kW · 16 | $19,200 | $1,285 |
| Vermont | 4.0 | 23.8¢ | 574 | 6.4 kW · 16 | $19,200 | $1,738 |
| Virginia | 4.5 | 17.6¢ | 1,032 | 10.0 kW · 25 | $30,000 | $2,260 |
| Washington | 3.8 | 14.6¢ | 955 | 10.8 kW · 27 | $32,400 | $1,709 |
| West Virginia | 4.0 | 16.3¢ | 1,027 | 11.2 kW · 28 | $33,600 | $2,080 |
| Wisconsin | 4.1 | 19.4¢ | 645 | 6.8 kW · 17 | $20,400 | $1,541 |
| Wyoming | 4.9 | 14.4¢ | 863 | 7.6 kW · 19 | $22,800 | $1,530 |
Sun hours: NREL NSRDB annual-average GHI, state-wide, rounded to 0.1. Price and consumption: EIA Electric Power Monthly Table 5.6.A (August 2026) and Table 5.A (2024). System sized for 100% of the state’s average consumption with 400 W panels, 22% losses and a south-facing roof; savings at full retail net metering.
Two patterns stand out. High-use Southern states (Louisiana, Alabama, Mississippi, Texas) need the biggest arrays because air conditioning drives consumption, not because their sun is weak. And the Northeast needs mid-size arrays despite thin sun because consumption there is low — most homes heat with gas or oil, which solar does not touch. The utility cost calculator shows the whole bill (electric, gas, water) by state, which is the right denominator for “how much of my utilities can solar replace.”
How much does solar cost in 2026 (with no federal credit)?
Residential solar in 2026 installs for $2.60–$3.40 per watt before incentives, so a typical 8 kW system is $21,000–$27,000 and a 6 kW system $15,600–$20,400. Quotes under $2.50/W are usually large, simple arrays from high-volume installers; over $3.50/W usually means a small system, a steep or complex roof, a main-panel upgrade or premium panels. Price per watt falls with size because permits, design, the inverter and the crew’s day are the same whether the roof holds 12 panels or 24.
The 30% federal residential credit is gone for 2026 purchases. The Section 25D credit ended for systems placed in service after December 31, 2025, so a system you buy and switch on in 2026 gets no federal tax credit — the calculator leaves it off. Third-party-owned systems are the exception: a lease or power-purchase agreement is owned by the installer’s financing company, which can still claim the commercial Section 48E credit on solar placed in service by the end of 2027 (or that began construction before July 5, 2026), and competitive lease pricing passes some of that through. Compare a lease’s 20–25-year payment stream against a cash purchase before assuming it is cheaper.
State and utility incentives still apply and go in the incentive box: state income-tax credits (New York 25% up to $5,000, South Carolina 25%, Arizona $1,000, among others), property-tax exemptions for the added value in most states, sales-tax exemptions, and solar renewable energy certificates (SRECs) in New Jersey, Pennsylvania, Maryland, DC, Illinois and a few other markets that pay per megawatt-hour produced. Check the DSIRE database for your ZIP; installers also know the local utility rebates.
| System size | Panels (400 W) | Roof sq ft | At $2.60/W | At $3.00/W | At $3.40/W | kWh per year at 4.6 h |
|---|---|---|---|---|---|---|
| 4 kW | 10 | 200 | $10,400 | $12,000 | $13,600 | 5,238 |
| 5 kW | 13 | 260 | $13,000 | $15,000 | $17,000 | 6,548 |
| 6 kW | 15 | 300 | $15,600 | $18,000 | $20,400 | 7,858 |
| 7 kW | 18 | 360 | $18,200 | $21,000 | $23,800 | 9,167 |
| 8 kW | 20 | 400 | $20,800 | $24,000 | $27,200 | 10,477 |
| 10 kW | 25 | 500 | $26,000 | $30,000 | $34,000 | 13,096 |
| 12 kW | 30 | 600 | $31,200 | $36,000 | $40,800 | 15,715 |
| 15 kW | 38 | 760 | $39,000 | $45,000 | $51,000 | 19,644 |
Roof area at 20 sq ft per panel plus fire-code setbacks of 18–36 in at ridges and edges in most states. Output at 22% losses, south-facing; multiply by (your sun hours ÷ 4.6) for your state.
How much does solar save you? Payback by state
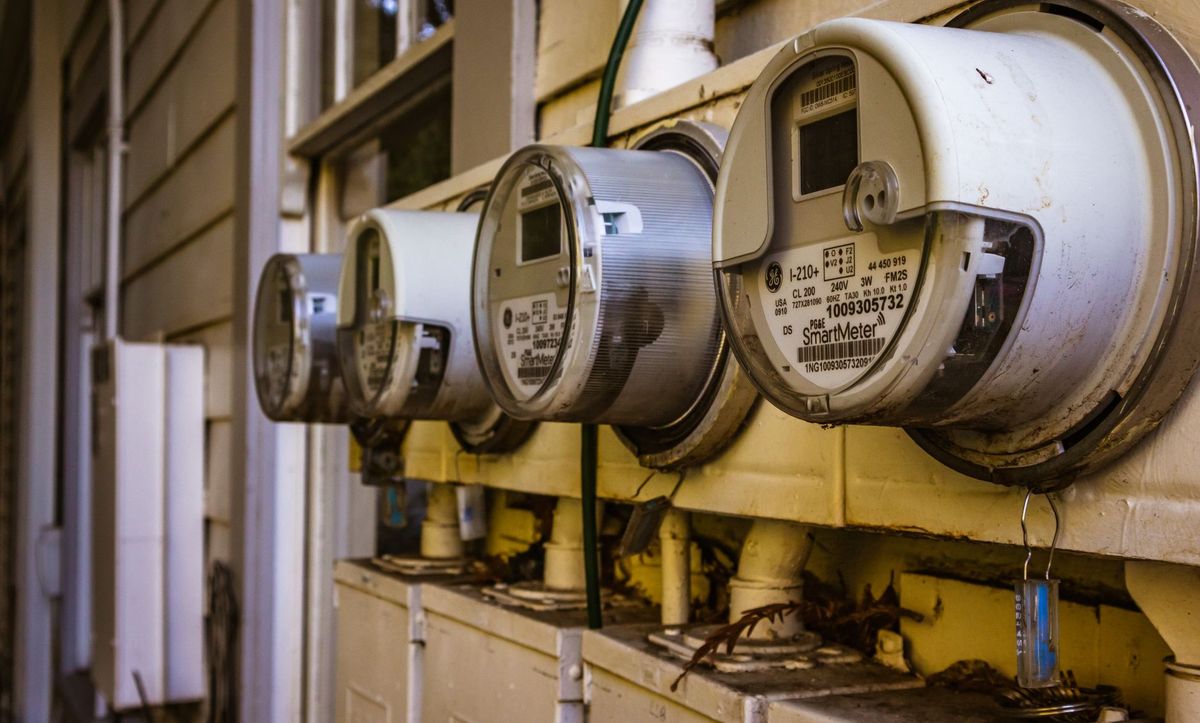
Solar savings are the kilowatt-hours you no longer buy, times your price. On the average home at 18.2¢, a 8.0 kW system saves about $1,903 in the first year, and with no federal credit the $24,000 system pays back in 12.6 years. Two inputs decide whether your number is 6 years or 16: the price you pay per kWh (which is why Hawaii at 47.2¢ pays back in 4.0 years and Washington at 14.6¢ in 19.0) and whether your utility credits exported power at the retail rate.
| State | Sun h | Price | System | Cost | Savings/yr | Payback | 25-yr net |
|---|---|---|---|---|---|---|---|
| 1. Hawaii | 5.6 | 47.2¢ | 4.0 kW | $12,000 | $3,009 | 4.0 yrs | $90,574 |
| 2. California | 5.8 | 29.8¢ | 4.0 kW | $12,000 | $1,965 | 6.1 yrs | $54,990 |
| 3. Maine | 4.0 | 32.1¢ | 6.0 kW | $18,000 | $2,194 | 8.2 yrs | $56,797 |
| 4. Massachusetts | 4.2 | 30.5¢ | 6.0 kW | $18,000 | $2,187 | 8.2 yrs | $56,550 |
| 5. New York | 4.2 | 28.6¢ | 6.0 kW | $18,000 | $2,055 | 8.8 yrs | $52,074 |
| 6. Rhode Island | 4.2 | 28.2¢ | 6.0 kW | $18,000 | $2,022 | 8.9 yrs | $50,925 |
| 7. District of Columbia | 4.4 | 26.0¢ | 6.4 kW | $19,200 | $2,083 | 9.2 yrs | $51,808 |
| 8. New Hampshire | 4.1 | 27.6¢ | 6.4 kW | $19,200 | $2,065 | 9.3 yrs | $51,194 |
| 9. New Jersey | 4.3 | 24.6¢ | 6.8 kW | $20,400 | $2,049 | 10.0 yrs | $49,443 |
| 10. New Mexico | 6.4 | 16.5¢ | 4.4 kW | $13,200 | $1,324 | 10.0 yrs | $31,925 |
| State | Sun h | Price | System | Cost | Savings/yr | Payback | 25-yr net |
|---|---|---|---|---|---|---|---|
| 1. Washington | 3.8 | 14.6¢ | 10.8 kW | $32,400 | $1,709 | 19.0 yrs | $25,875 |
| 2. North Dakota | 4.4 | 13.3¢ | 10.0 kW | $30,000 | $1,667 | 18.0 yrs | $26,841 |
| 3. Kentucky | 4.3 | 13.8¢ | 10.4 kW | $31,200 | $1,757 | 17.8 yrs | $28,698 |
| 4. Tennessee | 4.5 | 13.4¢ | 11.2 kW | $33,600 | $1,926 | 17.4 yrs | $32,047 |
| 5. Louisiana | 4.8 | 12.9¢ | 10.8 kW | $32,400 | $1,899 | 17.1 yrs | $32,356 |
| 6. Idaho | 4.7 | 13.4¢ | 8.8 kW | $26,400 | $1,574 | 16.8 yrs | $27,272 |
| 7. Oregon | 4.0 | 15.9¢ | 9.6 kW | $28,800 | $1,740 | 16.5 yrs | $30,535 |
| 8. Nebraska | 4.8 | 13.5¢ | 8.4 kW | $25,200 | $1,554 | 16.2 yrs | $27,787 |
| 9. West Virginia | 4.0 | 16.3¢ | 11.2 kW | $33,600 | $2,080 | 16.2 yrs | $37,319 |
| 10. Arkansas | 4.7 | 14.4¢ | 9.6 kW | $28,800 | $1,846 | 15.6 yrs | $34,130 |
Full retail net metering, 3% a year price growth, 0.5% a year panel degradation, no state incentive, no loan. The 25-year figure is savings minus the system cost in nominal dollars. Low-price, low-sun states can still work with a state credit, SRECs or a utility rebate — enter them in the tool.
Read the payback against how long you will stay. Under 8 years is a clear yes if you own the roof for a decade; 8–12 years works for a long-term home and still beats a savings account over 25 years; above 14 years the money usually does better on insulation, a heat pump or a smaller 50–75% offset system that avoids the exported-power discount. A loan changes the shape, not the total: at 7% over 20 years the payment on a $24,000 system is about $186 a month, which only beats the bill in high-price states. The home appreciation calculator lets you compare the 25-year solar figure with the same cash left in the house.
Net metering, net billing and batteries
Under net metering the utility credits every exported kWh at the retail price, so a system sized for 100% of annual use zeroes the energy part of the bill (you still pay fixed charges of $10–$40 a month). Under net billing exports earn a lower rate — a few cents to half the retail price — so the midday surplus is worth much less than the power you use while the panels run. California moved its investor-owned utilities to net billing (NEM 3.0) in April 2023 with export values averaging roughly 5–8¢ against retail rates above 30¢; Arizona, Hawaii, Nevada, Utah and several others use some form of reduced export credit, and more states review it every year. Set the export credit in the tool to match your utility; at 25% the payback on a 100%-offset system in California stretches from 6.1 years to 6.5 with no battery.
A battery fixes that by storing the surplus for the evening peak. A 13.5 kWh home battery installs for about $12,000–$16,000 in 2026 ($900–$1,200 per kWh), lasts 10–15 years, and shifts 10–13 kWh a day — enough to lift self-consumption from roughly 30–40% to 70–90% on a typical system. In a net-billing state with time-of-use rates a battery can cut the combined payback; in a full net-metering state it mostly buys backup power, not savings. Under net billing the better first move is often a smaller array (50–75% offset) that you consume as it is produced, then a battery when the price falls.
Is your roof right for solar?
- Orientation. South-facing at 15–40° tilt is the reference (factor 1.0). Southeast or southwest loses about 5%, east or west 15%, north 30% or more. West-facing arrays produce less but produce it in the late-afternoon peak, which pays better on time-of-use rates.
- Shade. A chimney shadow across one panel at 3 pm costs more than its share on a string inverter; microinverters or optimizers ($0.10–$0.25/W more) isolate each panel. A tree that shades the array for two hours a day is worth 10–20% of output.
- Area. Figure 20 sq ft per 400 W panel, plus 18–36 in fire setbacks at ridges and edges in most codes, so a 20-panel array wants a clear plane of about 500 sq ft. Dormers, vents and skylights break up rows.
- Roof age. Panels last 25–30 years, removal and reinstall for a re-roof costs $2,000–$5,000, so a roof with less than 10 years left should be replaced first — size that job with the roofing calculator. Asphalt and standing-seam metal are the easiest surfaces; tile and slate add $0.20–$0.50/W.
- Electrical. A 100-amp main panel often needs a $1,500–$4,000 upgrade or a smart load controller for an array over about 7 kW plus a battery or EV charger.
Does solar add to the value of the house?
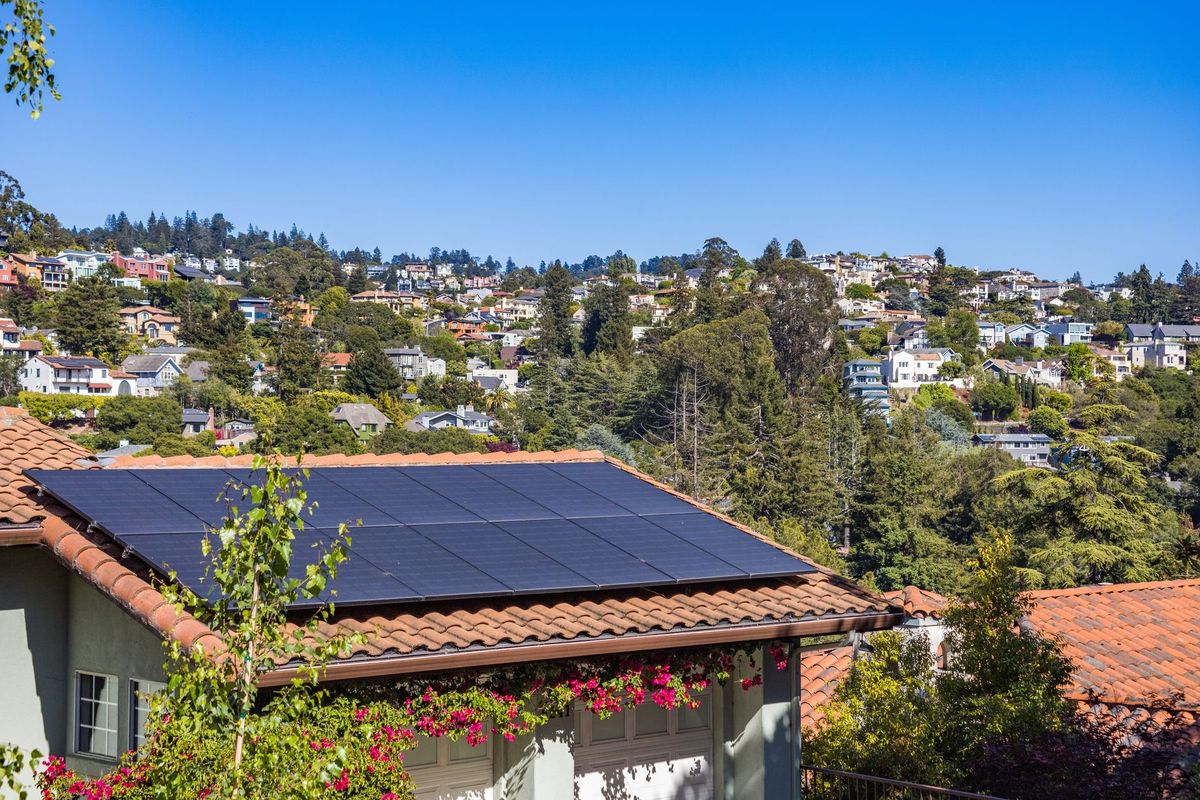
Owned systems do; leased systems generally do not. Zillow’s analysis of 2018–2019 sales found homes with solar sold for about 4.1% more than comparable homes without, and a Lawrence Berkeley National Laboratory study of 22,000 sales put the premium near $4 per watt of installed capacity — around $15,000 for a 4 kW system at the time. Those premiums roughly match today’s installed cost per watt, which means a buyer in a high-price state pays you back most of the system when you sell, on top of the bills you saved. A lease or PPA transfers a payment obligation, which some buyers refuse and most appraisers ignore.
Because the premium tracks the bill savings, it is largest where the payback is shortest: the states at the top of the payback table are also where appraisers have the most solar comparables. Check what houses are worth in your area on the home values map, run the resale math in the appreciation calculator, and keep the system’s production records — a documented 10,000 kWh a year is what an appraiser can value.
How this solar panel calculator works and where the numbers come from
Monthly kWh = bill ÷ (price ÷ 100) unless you enter kWh. Annual production per kW = sun hours × 365 × (1 − losses) × orientation factor. Required kW = annual kWh × offset ÷ production per kW; panels = required watts ÷ panel watts, rounded up; roof area = panels × 20 sq ft. Gross cost = system watts × cost per watt; net cost subtracts the incentive and, only if ticked, 30% federal credit. Year-one savings = self-consumed kWh × price + exported kWh × price × export factor. Simple payback = net cost ÷ year-one savings. 25-year net = Σ savings × (1 + growth)ⁿ × 0.995ⁿ − net cost. Sun hours are state-wide annual averages rounded from NREL’s NSRDB; prices and consumption from EIA (August 2026 Table 5.6.A, 2024 Table 5.A).
- NREL National Solar Radiation Database — annual average global horizontal irradiance maps — basis for the state sun-hour figures (rounded state-wide averages)
- EIA Electric Power Monthly, Table 5.6.A (average residential price by state, August 2026) and Table 5.A (2024 average monthly bill and consumption)
- IRS — Residential Clean Energy Credit (§25D) and Clean Electricity Investment Credit (§48E), 2025 law changes
- DSIRE — database of state and utility incentives for renewables
- Zillow Research (2019): homes with solar sold for 4.1% more; LBNL “Selling into the Sun” (2015): ~$4 per watt premium
Last reviewed November 6, 2026. Estimates only — verify local figures before you commit money.
Solar Panel Calculator: FAQ
How many solar panels do I need to power my house? +
About 20 panels of 400 W for an average U.S. home using 863 kWh a month in average sun; 12–15 in a sunny state with low use and 28–35 in a Southern state with heavy air conditioning or electric heat. Divide your annual kWh by about 1,310 kWh per kW (adjust for your sun hours) to get the system size, then by 0.4 for the panel count.
How much energy does one solar panel produce per day? +
A 400 W panel produces about 1.4 kWh a day in average U.S. sun after system losses — around 524 kWh a year. In Arizona (6.5 sun hours) it makes about 2.0 kWh a day; in Washington (3.8) about 1.2 kWh.
How much does a solar system cost in 2026? +
$2.60–$3.40 per watt installed before incentives, so an 8 kW system costs about $21,000–$27,000 and a 6 kW system $15,600–$20,400. There is no federal credit for systems placed in service in 2026; state credits, SRECs and utility rebates vary by location.
Is the 30% federal solar tax credit still available in 2026? +
No. The residential clean energy credit (Section 25D) ended for systems placed in service after December 31, 2025. Only third-party-owned systems (leases and power-purchase agreements) can still carry the commercial Section 48E credit, on projects placed in service through 2027, and the owner, not the homeowner, claims it.
How much does solar save per month? +
About $159 a month for the average U.S. home with a system sized to cover its 863 kWh of monthly use at 18.2¢ per kWh, before fixed utility charges. In high-price states the same system saves far more — about $260 a month in California, $265 in Massachusetts and $410 in Hawaii — and in the cheapest states (Louisiana, North Dakota) about $110–$120.
How long does solar take to pay for itself? +
About 12.6 years for the average U.S. home at $3.00 per watt with full net metering and no federal credit; 4.0 years in Hawaii and more than 18 in Washington. Panels are warranted for 25 years, so a payback under 12 years leaves 13 or more years of free power.
How much roof space do I need for solar panels? +
About 20 sq ft per 400 W panel, so a 20-panel, 8 kW system needs roughly 400 sq ft of panels on a clear south-, east- or west-facing roof plane, plus the 18–36-inch fire setbacks most codes require at ridges and edges — about 500 sq ft in practice.
What is a peak sun hour? +
A peak sun hour is one hour of sunlight at 1,000 watts per square meter, the standard used to rate panels. A location with 5 peak sun hours a day receives 5 kWh of solar energy per square meter per day on average, even though the sun is up for 12 hours; annual averages run from 3.0 in Alaska to 6.5 in Arizona.
Related tools and data
Utility Cost Calculator
Electric, gas and water bills by state and home size.
Roofing Calculator
Replace the roof before the panels go on: squares, bundles and cost.
Home Appreciation Calculator
Compare 25-year solar savings with the same cash in the house.
AC & BTU Calculator
Size the air conditioner that drives your summer kWh.
Home Values by State
What a 4% solar premium is worth where you live.
Rebuild Cost Calculator
Insure the house (and the array) for its replacement cost.